Pivot Table - Data |


|

|
|
|
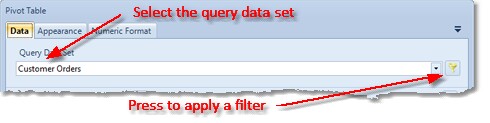
The Pivot Table editor window Data tab allows you to specify the data that will be used to render your pivot table.
Follow the steps below to specify the data; |
First select the Query data set that you wish to base your dashboard object;
If you wish to, press the filter button to apply a filter to your data set; |
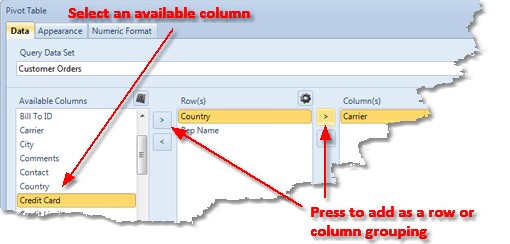
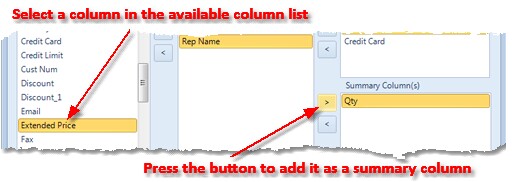
Next, add the row and column groupings you require. You can do this by selecting the appropriate available column and pressing the add button to the left of the row(s) list or the add button to the left of the column(s) list, or simply dragging columns from the available columns list to the row(s) list or column(s) list.
|
|
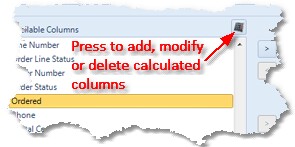
If the value you require is not directly available from the columns listed, press the Calculated Column button to open the Calculated Column Editor which allows you to add, modify or delete calculated columns. |
|
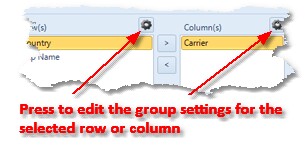
If you wish to, you can change the way group values are grouped, sorted and displayed by selecting the group options button to open the group options window. |
|
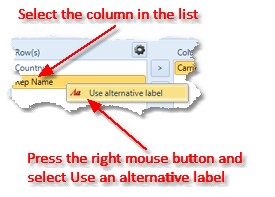
You can specify an alternative column label for the row and column groupings if required. To specify an alternative label, select the row or column grouping in the list, press the right mouse button and select Use alternative label from the drop down menu. This will open the edit label dialog box to allow you to edit the label. |
|
Next, select which summary columns you require.
|
|
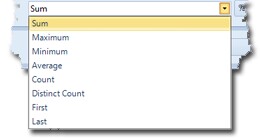
For each summary column, select the summary operation you wish to be applied. Distinct count is the number of distinct values in the column for the group selected. |
|
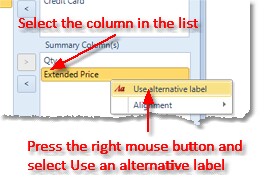
You can specify an alternative column label for the summary column if required. To specify an alternative label, select the summary column in the list, press the right mouse button and select Use alternative label from the drop down menu. This will open the edit label dialog box to allow you to edit the label. |
|
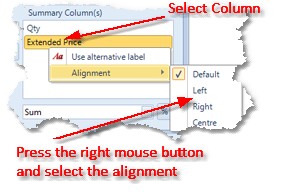
The pivot table will automatically align numeric columns to the right, and non-numeric columns to the left. You can override this behaviour by selecting the column in the list, pressing the right mouse button then selecting either left, right or centre in the Alignment sub menu.
|
|
Finally, if you want your summary column to be displayed as a percentage, select the percentage button. ( |
|
| ||||