Edit Dashboard Tab |


|

|
|
|
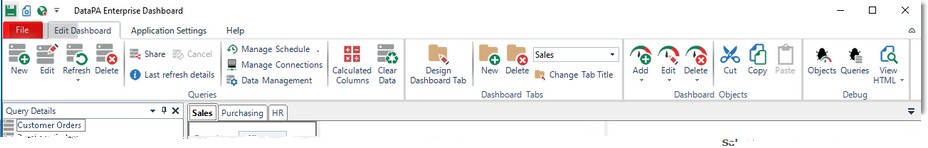
The Edit Dashboard Tab provides access to commands to edit the dashboard you have open in the DataPA Enterprise Dashboard application. To open the file tab, click on it in the application header. |
|
|
|
|
New Query - Opens the Query Wizard to allow you to create a new query. |
|
Edit Query - Opens the Query Wizard to allow you to edit the selected query. |
|
Refresh Query - Refreshes the currently selected query. The query will refresh in the background, allowing you to work while the query is refreshing. To cancel the query, press the Cancel Query button, press the Cancel button on the refresh query alert, or select the Cancel Refresh Query option on the context menu of the query treeview. |
|
|
|
Share Query - Allows you to save the current selected query as a query file to share it with other DataPA applications. |
|
Cancel Refresh Query - Cancels the current refresh query operation. |
|
Show last run details - Opens the Last Refresh Details window, showing details of the last time the queries were refreshed, date time and any error messages returned. |
|
Manage Schedule - Opens the Dashboard Properties window open at the Refresh Schedule Tab. |
|
Manage Connections - Opens the Dashboard Properties window open at the Connections Tab. |
|
Data Management - Opens the Dashboard Properties window open at the Data Management Tab. |
|
Calculated Columns - Opens the Calculated Column Editor dialog box to allow you to create, modify and delete any calculated columns available in your dashboard. |
|
Clear Data - Clears all stored data from within the dashboard. This can be useful if you want to save or publish a large dashboard, as it will significantly reduce the size, or if you want to share the dashboard without any of the existing data. The dashboard will not render any objects until the query(s) are refreshed. (If you publish a dashboard without data, the service will automatically refresh the queries once published). |
|
Design Dashboard Tab - Changes the mode of the current dashboard tab to design mode. This allows you drag items in the tab to re-arrange them. For a detailed tutorial on creating a dashboard, see the getting started tutorial. |
|
Preview Dashboard Tab - Changes the mode of the current dashboard tab to preview mode. This allows you view the tab as it will appear in a viewer or web page. For a detailed tutorial on creating a dashboard, see the getting started tutorial. |
|
New Tab - Creates a new dashboard tab after the last existing dashboard tab. You can rename the tab by pressing the Change Tab Title button. You can re-order tabs by dragging them in the dashboard work area. |
|
|
Tab Selection List - Displays and allows you to select the currently selected tab. You can also change the title of the currently selected tab by typing in the text box. |
|
|
Change Tab Title - Opens the Tab Title dialog box to allow you to enter the tab title. |
|
Add Dashboard Object - Opens a context menu to allow you to add a new object to the currently selected tab. You can also add objects to your tabs by dragging them from the toolkit. Once you have selected the type of object, either the Dashboard Object Definition, Gauge Editor, Pivot Table Editor, Treeview Selection Panel Editor or Control Panel window opens to allow you to specify the details of the object. |
|
Edit Dashboard Object - Opens either the Dashboard Object Definition, Gauge Editor, Pivot Table Editor, Treeview Selection Panel Editor or Control Panel window to allow you to edit the details of the currently selected object, or the dashboard object you select in the drop down menu. You can also edit control panels, dashboard objects, pivot tables and gauges by double clicking the left mouse button over them in the dashboard work area. |
|
Delete dashboard Object - Deletes either the selected Dashboard Object (if you just press the button), or opens a drop down menu to allow you to select a dashboard object you wish to delete. |
|
Cut Dashboard Object - Deletes the selected dashboard object and copies it to the clipboard. The copied dashboard object is copied as both an image and a dashboard object, so it can be pasted back into a dashboard, or any application that accepts an image. |
|
Copy Dashboard Object - Copies the selected dashboard to the clipboard. The copied dashboard object is copied as both an image and a dashboard object, so it can be pasted back into a dashboard, or any application that accepts an image. |
|
Paste Dashboard Object - Pastes a copied dashboard object on to the currently selected tab. |
|
Debug Objects - When checked, each dashboard object will be displayed in debug mode. Whilst in debug mode, the dashboard object will by default display a text editor with the XML definition of the dashboard object. You can toggle the display of this text box on and off for the selected dashboard object by pressing control+D. NB This button is only visible if the Show Debug Options button is selected. |
|
Debug Queries - When checked, sets the debug option on for queries so they produce debug log files on the server and client when they run. |
|
View HTML - Opens a window showing the HTML source used to render the selected dashboard object, or the dashboard object selected from the drop down list. NB This button is only visible if the Show Debug Options button is selected. |
| ||||