Dashboard Object Definitions - Colour |


|

|
|
|
The Dashboard Object Definition window colour tab allows you to specify the colours used to render the object. There are two distinct appearances for this tab, if you are editing a single series line or area chart, and editing any other type of chart.
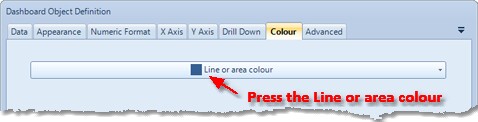
Follow the steps below to specify the colours for a single series area or line chart; |
Press the Line or area colour button and select the desired colour. If you select No color the chart will use a default colour.
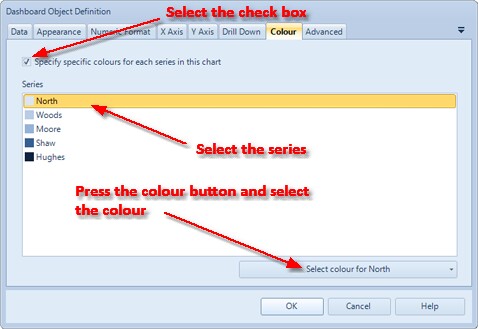
Follow the steps below to specify the colours for all other chart types;
First select the Specify specific colours for each series in this chart check box. Then, select a series in the series list, and press the Select colour for <series> button. If you select No color the chart will use a default colour for the selected series.
NB: Series colours are consistent across the whole dashboard. This means any series with the same name, on an object that also has the Specify specific colours for each series in this chart option checked will appear the same colour.
|
| ||||