Adding gauges to a report |


|

|
|
|
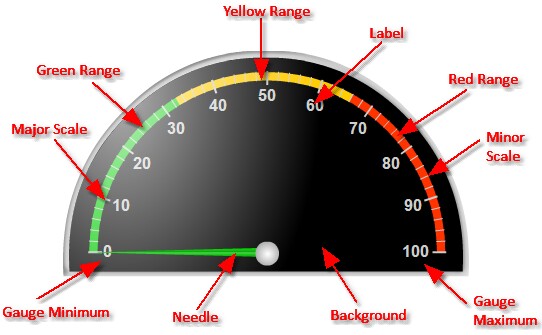
Gauges allow you to simply represent numerical data as a KPI (key performance indicator) on the report. See below for details on how to add, edit and delete gauges whilst in design mode in the report designer.
|
|
|
|
Adding a gauge |
|
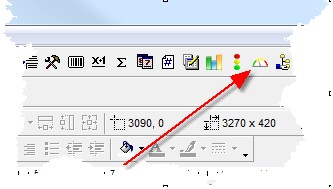
Select the gauges button from the Tools Panel. |
|
Select the data you want to represent with the gauge. This can be either a database field, an expression or a fixed value. |
|
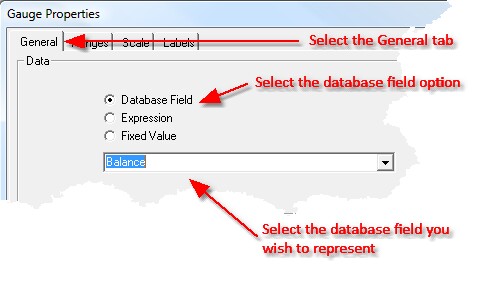
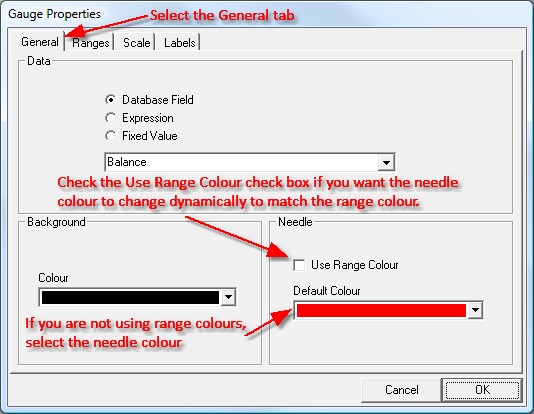
If you want your gauge to represent the value of a database field returned by your query, select the General tab in the gauge dialog box, select the Database Field option, and select the field you wish to use. |
|
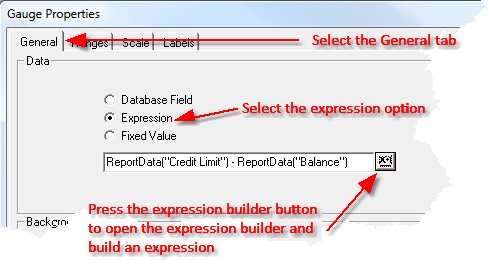
If you want your gauge to represent the value of an expression, select the General tab in the gauge dialog box, select the Expression option, and press the expression builder button to open the expression builder and build your expression. |
|
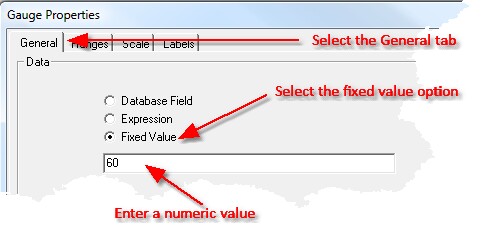
If you want your gauge to represent a fixed value, select the General tab in the gauge dialog box, select the Fixed Value option, and enter a numeric value. |
|
Define the background colour and needle colour for your gauge. |
|
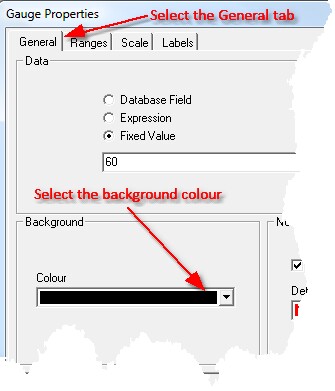
To define the background colour of your gauge, select the General tab, then select the desired background colour. |
|
To define the colour of the gauge needle, select the General tab. You can then either specify that the needle colour changes to match the range colour that represents the value, or define a static colour.
To specify that the needle colour changes to match the range colour that represents the value, check the Use Range Colour check box.
To specify a static colour for the gauge needle, uncheck the Use Range Colour check box and select the needle colour. |
|
Define the minimum and maximum values for your gauge, then for each colour range, define whether or not the colour is visible and its minimum and maximum values. You can define colour range minimum and maximums in two ways, either specify simply the minimum and maximum values, or specify the specific range for each colour.
For each minimum and maximum value, use the corresponding value panel to define either a fixed value, a database field value or an expression value. |
|
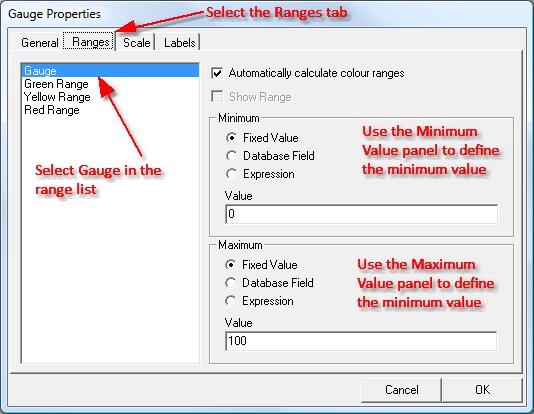
To define the minimum and maximum values for your gauge, select the Ranges tab, select Gauge in the range list, use the minimum value panel to define the minimum value and use the maximum value panel to define the maximum value. |
|
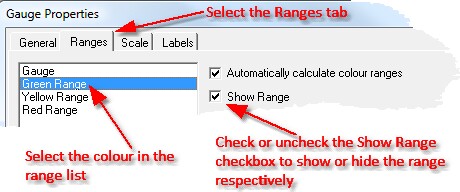
To define whether or not a colour range is displayed in the gauge, select the Ranges tab, select the colour range in the Range List, the check the Show Range checkbox to show the range, or uncheck the Show Range checkbox to hide the range. |
|
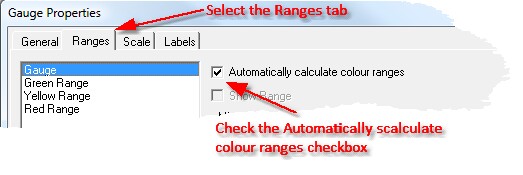
To specify that the minimum and maximum values for each colour range are calculated automatically based on your gauge minimum and maximum values, select the Ranges tab, then check the Automatically calculate colour ranges checkbox.
|
|
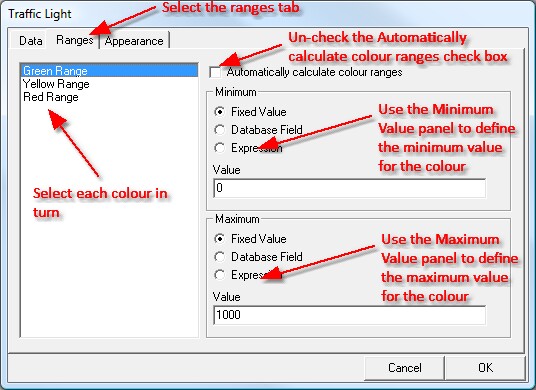
To specify specific Minimum and Maximum values for for each colour, select the Ranges tab in the gauge dialog box, uncheck the Automatically calculate colour ranges check box, select each colour in turn and define your minimum and maximum values for that colour using the corresponding value panel. |
|
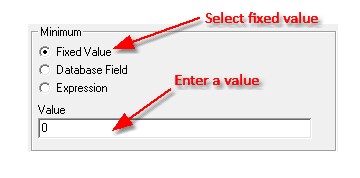
The Minimum and Maximum value panels allow you to define minimum and maximum values using either a database field, an expression or a fixedfixed value. |
|
To define a value using a fixed value, select the Fixed Value option and enter the value. |
|
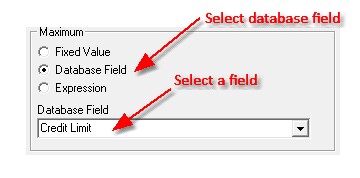
To define a value using a Database Field, select the Database Field option and select a field. |
|
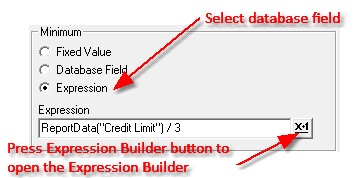
To define a value using an expression, select the Expression option, then press the expression builder button to open the expression builder and build your expression. |
|
The scale properties allow you to determine the appearance of the major and minor scales. |
|
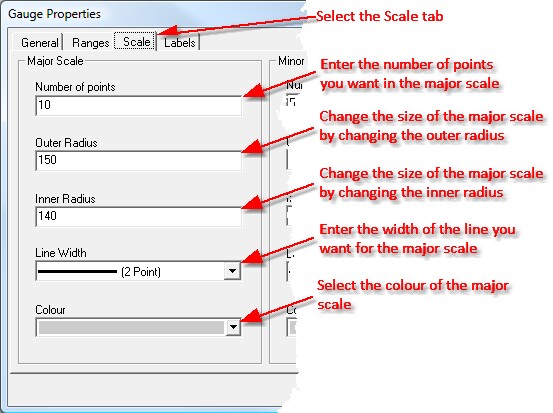
To set the appearance of the major scale, select the Scale tab, enter the number of points (lines) you want in the major scale, change the size and position of the scale lines with the outer and inner radius settings, and set the colour and width of the lines.
|
|
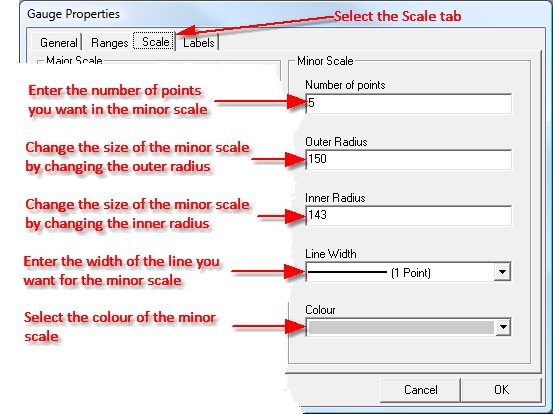
To set the appearance of the minor scale, select the Scale tab, enter the number of points (lines) you want the minor scale to have for each major scale line, change the size and position of the scale lines with the outer and inner radius settings, and set the colour and width of the lines. |
|
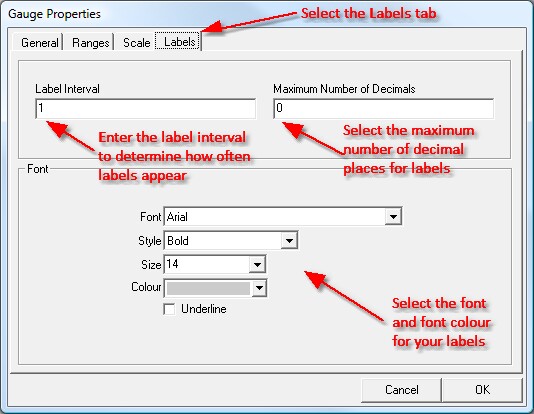
The label properties allow you to determine the format and appearance of labels on your gauge. |
|
To set the label properties, select the Labels tab, then enter a value for the Label Interval. Labels appear against major scale lines.
A label interval of 1 indicates that a label appear for every major scale line. A label interval of 2 indicates that a label appears every second major scale line. A label interval of 3 indicates that a label appears every second major scale line, etc.
Next, enter the maximum number of decimal places for each label, then select the font and font colour for your labels.
Once finished, press OK to add your gauge to your report resize the gauge as required.. |
|
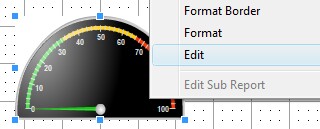
Editing a gauge |
|
Select the gauge in the sections panel, press the right mouse button and select Edit from the drop down menu. |
|
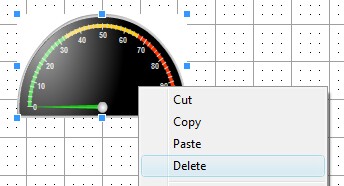
Deleting a gauge |
|
Select the gauge in the sections panel, then either press the delete key, or press the right mouse button and select delete from the drop down menu. |
|
| ||||