Integrated bubbles and maps
We're thrilled to announce the release of OpenAnalytics 6.5, packed full of new functionality such as maps, scatter and bubble charts, accessibility options, API parameters and further integration and performance improvements.
Mapping your data made easy
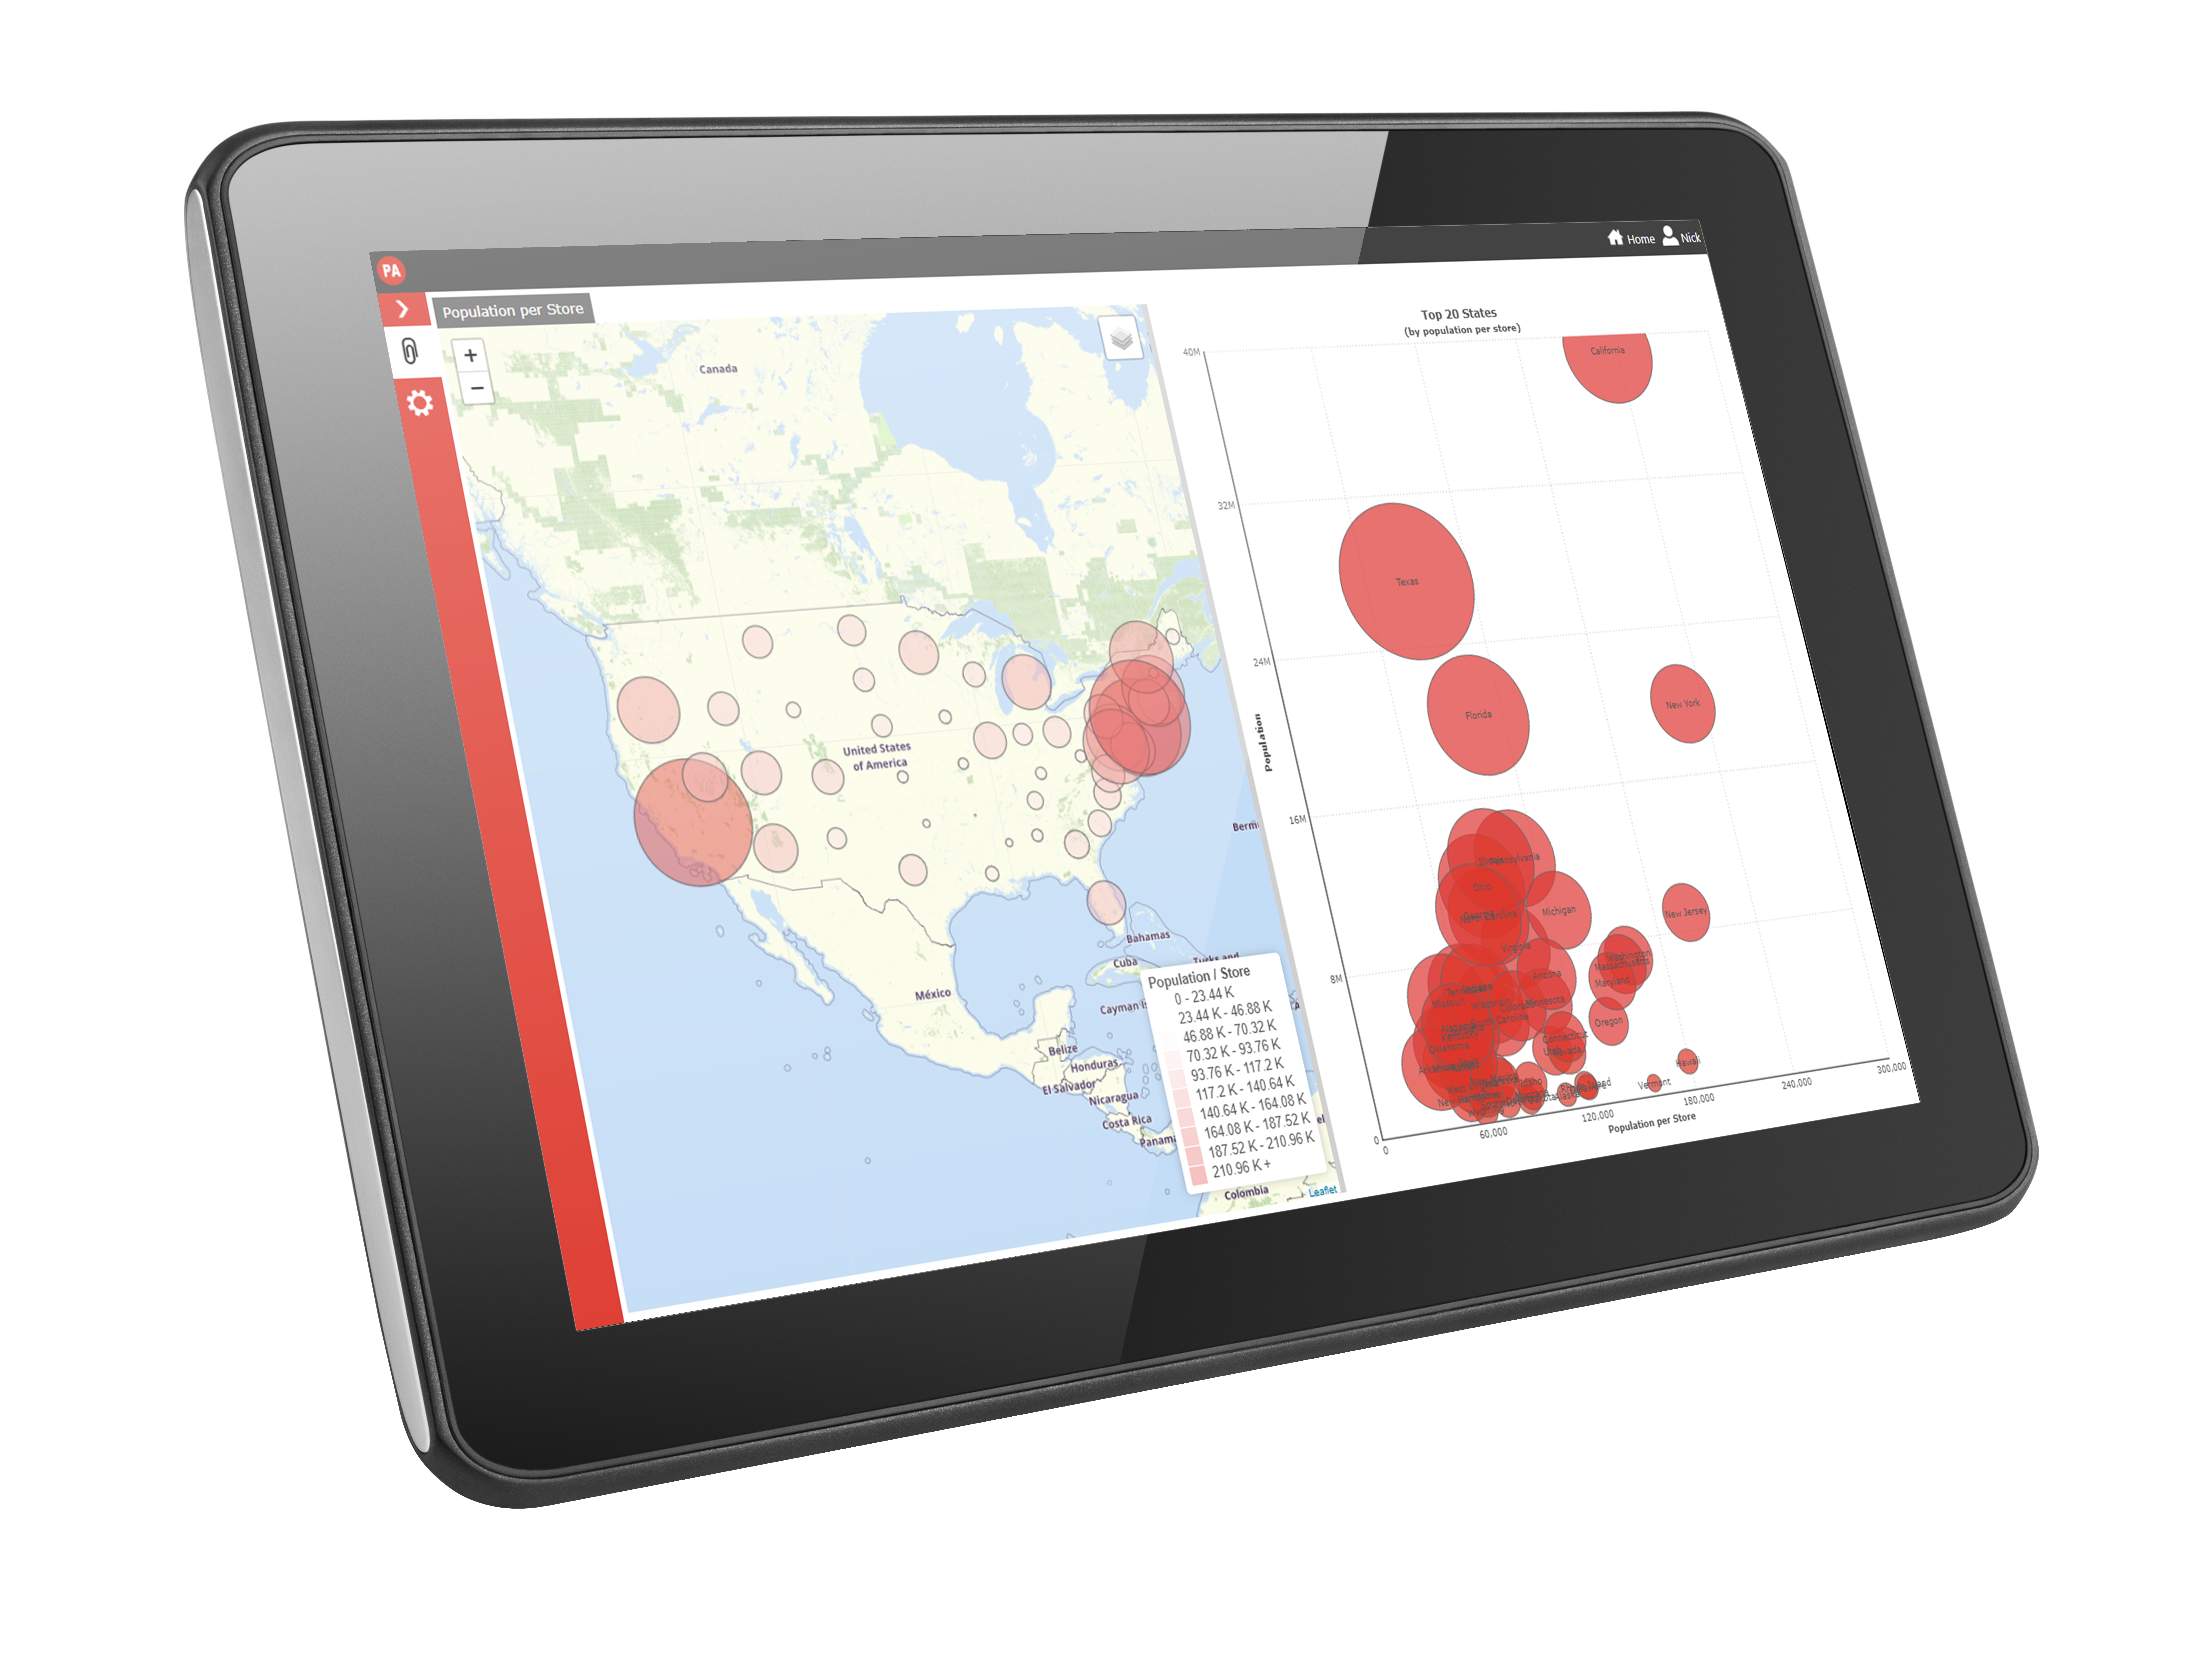
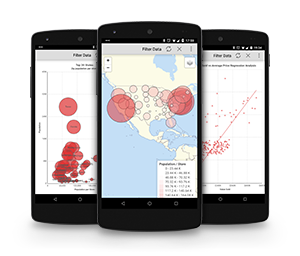
DataPA OpenAnalytics 6.5 introduces new mapping functionality that makes mapping any data with location information easy. Whether your data contains latitude and longitude, postal codes or simply vague place names, OpenAnalytics 6.5 will automatically search for the location plot the data on beautiful maps as markers, circles or a huge range of available geographic areas.
Visualise complex data relationships
The introduction of new scatter and bubble charts allow you to quickly visualise and understand complex data relationships, such as how average item value effects total sales and margin across stores.
Simpler integration with your app
Filtering content based on values in your application is now easier than ever. With the new API filter objects, you can easily pass values into calculated columns and filters on any dashboard regardless of whether you are embedding dashboards in a client or web interface.
Cloud and machine learning integration
Build dashboards that summarise millions of rows with OpenAnalytics 6.5's tight integration with our cloud and machine learning analytics platform, inmydata.
Faster, leaner throughout
As ever, we've worked hard with this release to improve performance and memory usage throughout the application. We've replaced older threading technology with more up to date task technology throughout the product to improve our utilisation of the OS multi-tasking architecture, making everything faster and less memory hungry.
It's easier than you think to move to inmydata, our AI driven successor to OpenAnalytics


